Module 6 – Development, Evaluation and Attainment of a Breeding Goal
Thursday, 2 December 2021
PIC Breeding Programs are made up of sub-goals that all contribute towards the final target.
PIC Breeding Programs are made up of sub-goals that all contribute towards the final target – maximizing the profit potential of the market pigs in our clients’ herds. These goals aren’t set in concrete and are re-assessed every few years via feedback from clients and industry to ensure they deliver what is needed.
While the setting of goals may seem straightforward, achieving them may be more difficult. The various traits that are selected for in a breeding program are not inherited at the same level. In fact, heritabilities of various traits can vary greatly. Growth and carcass traits tend to be moderately to highly heritable; at PIC, both our Maternal and Sire Lines are evaluated for Backfat, Lifetime Growth Rates and Loin Depth. In addition, the Terminal Sire Lines are also evaluated for Feed Intake. On the other hand, reproductive traits, which the PIC Maternal Lines only are evaluated for (as well as most of the growth traits) are usually lowly heritable, i.e., influencing reproductive traits is much harder to do. With the introduction of genomics, PIC has been able to make more rapid improvements for many of the maternal traits. But some traits, like pre-weaning survival (PWS) have been complicated to improve. To understand how PIC approached the issue of improving PWS through genetic selection, let’s start by examining which factors influence pre-weaning survival.
Pre-Weaning Survival Influencers-what are they?
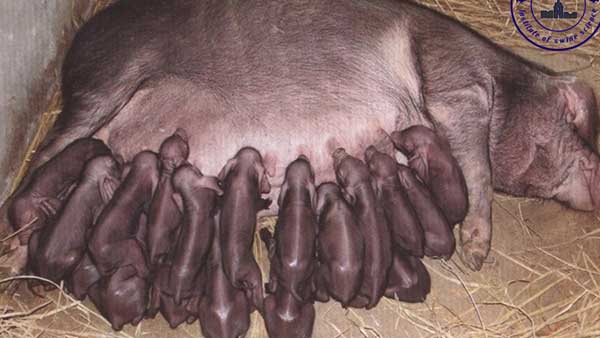
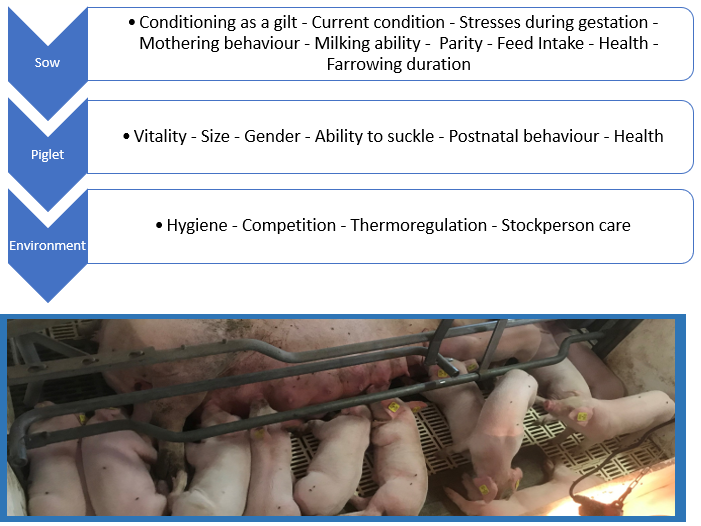
Piglets are born with so many things that could work against them, it must sometimes seem like a miracle that so many do survive and thrive. The factors that influence a piglet’s survival to weaning originate from three major areas (Figure 1):
- Their mother
- Themselves
- Their environment
When clients began to push for bigger litters, the original model implemented was quite simple-just focus on increasing total born. This proved to be incredibly successful. But as litter size increased, piglet Birthweight (BWT) decreased, which makes sense…….more pigs è less room èsmaller pigs. Smaller pigs i.e., pigs less than 900g tend to have a lower rate of survival than bigger pigs, so pre-weaning survival in these larger litters was affected. Total born was negatively correlated (and quite strongly as well) to BWT and PWS. But placing selection pressure on just increasing BWT was also not the answer by itself. Sure, we could improve piglet BWT, but there has to be an upper limit there too, as overly large piglets could lead to farrowing difficulties. Also, the existing correlations would mean, PWS would improve but litter size would decrease, which kind of defeated the purpose. We didn’t want to solve one problem by creating another…….so let’s re-visit the original problem which is extra-large litters and poor PWS. Do all breeds of pigs that have high total born numbers also have poor PWS?
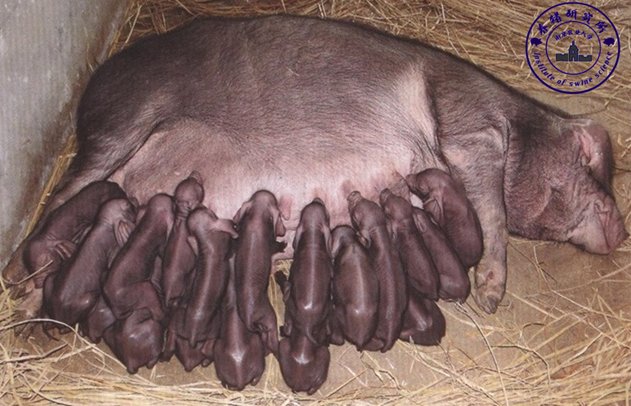
Big litters have the lowest PWS……or do they?
Good question and the answer is NO! If we look at other breeds of pigs like the Meishan and Erhualian (Figure 2), these breeds have very large numbers of pigs born alive, but they have a much higher survival rate compared to the typical European/American commercial lines. These differences in PWS between Meishan-like breeds and commercial breeds are the result of differences between the maternal characteristics of these breeds. The uterine environment of a Meishan sow has adapted to supporting these very large litters through a smaller but a much more efficient placenta. The smaller placenta means there is more room in the uterus for piglets; extra embryos (compared to commercial breeds) can implant and develop to term. Although the placenta is smaller it’s also much more efficient in taking up nutrients from the sow’s bloodstream. This placental efficiency supports these very large litters which are made up of smaller but more even piglets that are more physiologically mature with extra vitality and resilience than modern commercial bred newborn piglets.
So, it appears we CAN have larger litters and good PWS; we just needed to change the model we were using. If we go back to the original model that was used to improve litter size, it was simple and successful (litter size was higher) but because of the negative correlation with both BWT and PWS, it’s not exactly what the doctor ordered and definitely not what pig producer was looking for. PIC needed to find a way to break the negative correlation i.e., to increase litter size without negatively impacting PWS. We knew it could be done-the Meishan model shows us this very well; Meishan piglets may be small but their survivability is good, as their viability comes about by a complex interaction of maternal and piglet connections; so, to impact piglet survivability we needed to figure out how various sow and piglet traits contribute to piglet vitality, and then include them in our selection model, making for a much more complex model………and that’s what happened.
The Maternal Effect Model
PIC moved to a much more complex model known as a maternal effect model that takes into account both individual piglet and maternal trait heritabilities. With this model PIC was able to break the negative correlation between litter size and PWS. This maternal effect model is an extremely complicated model and is only as good as the robustness and amount of data collected. The PIC use of genomics has meant that we can produce the most scientifically accurate Estimated Breeding Values (EBVs) for the animals we select. While genomics improves the accuracy of the EBVs, it doesn’t reduce the amount of data required; any genetic selection and improvement has its foundation on huge amounts of data collected from extremely large numbers of animals. This is important to remember; these calculations and simulations have mountains of data; it is a very complicated model.
The traits that are selected are the ones with the highest heritabilities – the higher the heritability, the greater chance of this particular selection paying off i.e., being passed onto the next generation. Reproductive traits don’t tend to have great heritabilities and PWS is no exception. As a maternal trait PWS has a heritability of 0.08 (Figure 3); as a piglet trait, this heritability is even lower (0.05). As a result PIC selects for the maternal genetic component rather than the individual piglet component because the heritabilities are higher. The great thing with genetics is that traits can be influenced by many genes which means that correlations can be found between traits. Fortunately for PWS improvement, PWS as a maternal trait is highly correlated to BWT (Figure 3). PIC chose the PWS maternal trait (rather than the individual piglet trait) as the heritabilities and correlations are greater as a maternal trait.
PIC also placed greater weighting during the selection process on PWS rather than BWT as maximising BWT is not our target……………I can already hear “WHAT…!!!!” bellowing from your lips! First up and most importantly, the target for any producer is to reduce PWS; measuring BWT is a lever to make this happen quicker because of the great positive correlation between the maternal traits of PWS and BWT. But in saying this, the next section will confuse you as the results will show that there were improvements in BWT. Still, optimizing BWT wasn’t our target, as this model would have been even more complex and it would lead to adverse consequences like increased farrowing difficulties, increased stillborns, etc. Optimizing PWS on the other hand, is what PIC was aiming to achieve. So, that’s what happened; to increase the selection accuracy for PWS (which has a very low heritability on its own), PIC added BWT to the maternal effect model.
Adding Birthweight to the Maternal Effect Model
PIC were successful in improving Total Born, but could we also be successful in improving PWS? The answer was a resounding YES! The proof was in the data (Figures 4 and 5). By including BWT to increase the selection accuracy for PWS, PIC was able to impact PWS without sacrificing the gains made in litter size-killing 2 birds with one stone! The amount of data needed to do this successfully is staggering. Every pure-bred litter has the dam recorded, all piglets are weighed at individually at birth (born alive and stillborn), and all live piglets are double ear-tagged and followed i.e. all fostering movements are tracked and individual mortalities recorded. All the record keeping and data accumulation is managed through a specific set of detailed protocols with no short cuts permitted; the model is only as good as the data, and the data must be robust. Its only through using innovative technology, strictly adhering to good science and data collection, can PIC make these breakthroughs for our clients.